Organization of the plasma membrane is probe and cell line dependent
The plasma membrane is a heterogeneous bilayer structure composed of a plethora of lipids and proteins. Its organization is hugely debated, especially about the existence of domains consisting of cholesterol, sphingolipids and proteins. Many fundamental signalling pathway events take place at the plasma membrane and membrane organization can have important implications in the outcome of signalling. In this study, we investigate the naturally occurring variation of dynamics and organization of five different closely related cell lines using up to four different lipid probes. For the outer membrane leaflet, we use DiI-C18, a marker of free diffusion and GFP-GPI (glycosylphosphatidylinositol anchored protein) as a marker of transient domain-confined diffusion. For the inner membrane leaflet, we use PH-PLCδ-RFP, a PIP2 binding protein, and PMT-GFP, a GFP tagged plasma membrane targeting domain that is shown to exhibit cytoskeleton sensitive diffusion. We applied Imaging Fluorescence Correlation Spectroscopy (imaging FCS) on a Total Internal Reflection Microscope (TIRFM) which provided diffusion coefficients (D), the Arrhenius activation energy for diffusion (EArr), and the FCS diffusion law intercept (τ0), which report on membrane fluidity, molecular packing, and diffusion mode of the probes (free, domain, or hop diffusion), respectively. Our results showed that each of the probes is characterized by a unique combination of parameters (D, EArr, τ0) which varies with cell-type and temperature. Hence, organization and mode of diffusion of probe molecules is strongly environment dependent. While comparing the measurements, which are conducted with the same probe at different temperatures and within different cell lines, it is essential to consider the difference in membrane organization.

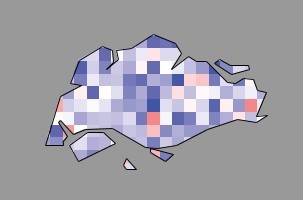
Legend: The quantitative analysis of membrane dynamics was performed by imaging total internal reflection fluorescence correlation spectroscopy (ITIR-FCS). ITIR-FCS is combined with FCS diffusion laws to obtain spatially resolved diffusion coefficient maps and FCS diffusion law intercept. Measurements are performed at a temperature range of 298 K-310 K, and Arrhenius activation energy of diffusion is calculated using the Arrhenius equation.