
A Matlab script for processing TRAST monitoring data
Introduction
Transient State (TRAST) monitoring by time-modulated illumination is a technique that can measure the relative populations of fluorophores in singlet and triplet (transient) states, and their transition rates, by measuring the fluorescence emission intensity after exciting the sample with trains of pulses of different characteristics. TRAST monitoring was presented in 2007 (Sandén et al. 2007). To date, it has been applied on confocal microscopes (Sandén et al. 2007, Sandén et al. 2008), total internal reflection microscopes (Spielmann et al. 2010) and Single Plane Illumination Microscopes (Mucksch et al. 2014; Karampatzakis et al. 2016).
TRAST monitoring has found applications in life sciences for measuring oxygen consumption during the contraction of a single smooth muscle cell (Geissbuehler et al. 2010), for investigating patterns of altered oxygen consumption in cancer cells (Spielmann et al. 2014), for assessment of transferrin recycling in cells (Geissbuehler et al. 2012) and for measuring oxygen concentrations inside bacterial biofilms (Karampatzakis et al. 2016).
Downloads
The script is separated in two parts. Firstly, the images taken with increasing duty cycles are read, and a stack is created and exported. Secondly, the stack is imported and processed. A three-state energy model (ground - excited singlet - excited triplet) is considered and used for the fit (Geissbuehler et al. 2010). The user can choose which parameters should be held constant during fitting, what the starting values should and a number of other parameters. The two scripts and a demo data set can be downloaded below:
1. The prepare_stack.m script reads the contents of a folder where the images (.tif) taken with increasing duty cycles are saved. The filenames need to resemble each duty cycle, For example, if 4% duty cycle was used, the filename should be 4.tif. The period of pulse repetition is set within the script. The script visualises the raw intensity curves of each pixel saves the variables as sample.mat
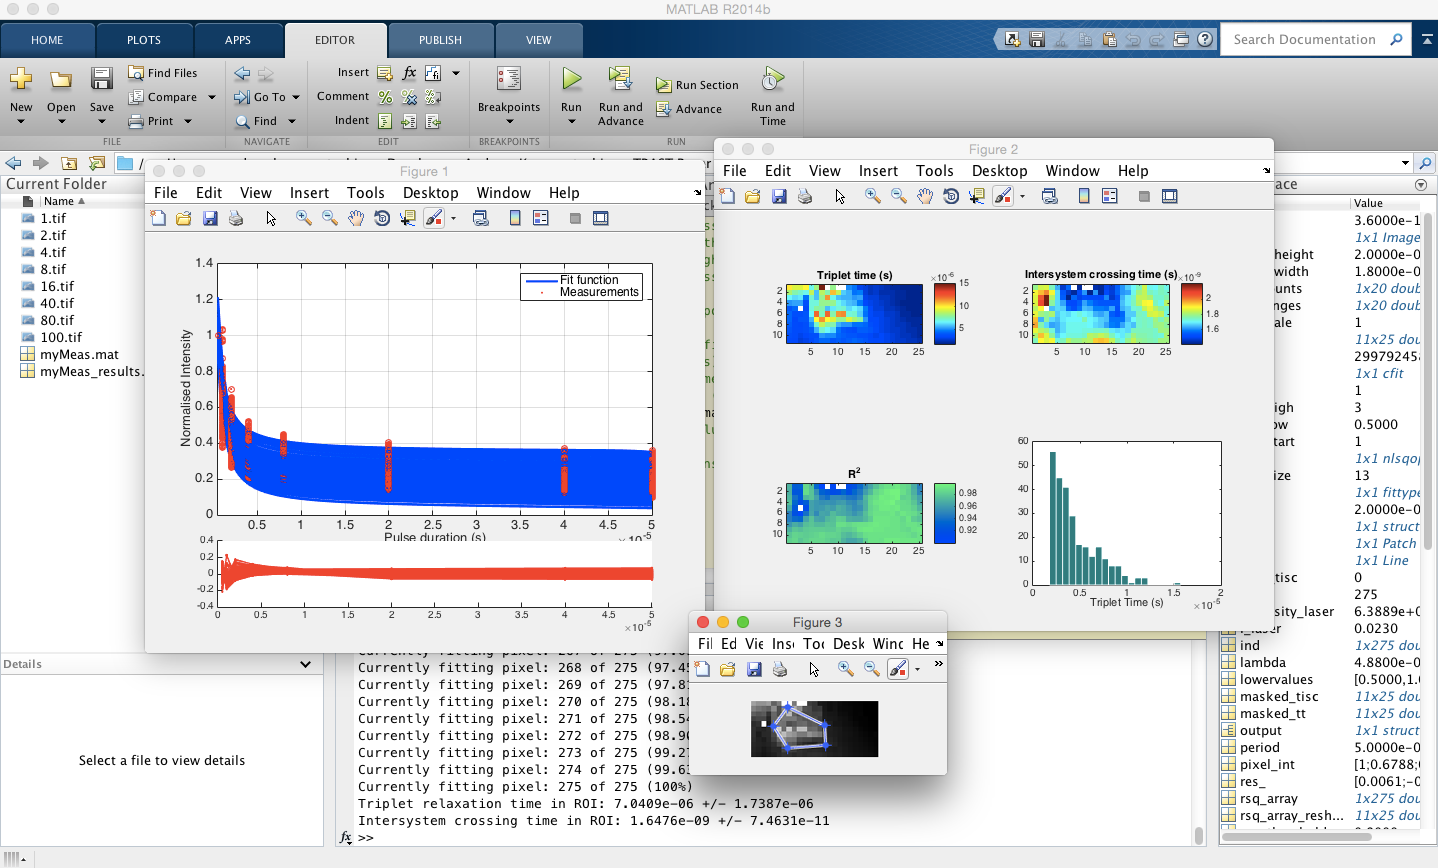
2. The process_data.m imports the .mat file created previously by prepare_stack.m and calculates the triplet relaxation and intersystem crossing times in a pixel-wise manner. The value of interesystem crossing can either be held or free-fitted. Experimental parameters and starting values for the fitting parameters are defined by the user. The script allows for reduction of image dimensions by binning, using the built-in Matlab function imresize . This functionality is especially useful for quick-assesments of the fit quality of new images when trying to determine the starting values. It takes approx. 35 mins to fit an image of 30 x 30 (= 900) pixels on a 1.7 GHz Intel Core i7 / 8 GB RAM. Finally, the script has an option for the user to interactively define a region of interest (ROI) and investigate the triplet relaxation and intersystem crossing times within. This feature uses the built-in Matlab function roipoly which allows the user to create a mask.
3. Demo data : A set of TRAST images of a Pseudomonas aeruginosa biofilm colony, taken 3 days post inoculation. The pulse train period was 50 us. Each file name corresponds to the duty cycle under which was taken.
TRAST monitoring publications
Geissbuehler M., Kadlecova Z., Klok H.-A, and Lasser T. 2012. Assessment of transferrin recycling by Triplet Lifetime Imaging in living cells. Biomedical Optics Express 3(10):2526-36.
Karampatzakis A., Sankaran J., Kandaswamy K., Rice S. A., Cohen Y. and Wohland T. 2016. Measurement of Oxygen Concentrations in Bacterial Biofilms using Transient State Monitoring by Single Plane Illumination Microscopy. Submitted, under review.
Mücksch J, Spielmann T, Sisamakis E, and Widengren J. 2014. Transient state imaging of live cells using single plane illumination and arbitrary duty cycle excitation pulse trains. J. Biophotonics 1-9.
Sandén T., Persson G., Thyberg P., Blom H., and Widengren J. 2007. Monitoring kinetics of highly environment sensitive states of fluorescent molecules by modulated excitation and time-averaged fluorescence intensity recording. Anal. Chem. 79(3330-41).
Sandén T., G. Persson, and J. Widengren. 2008. Transient state imaging for microenvironmental monitoring by laser scanning microscopy. Anal. Chem 80:9589-96.
Spielmann T., Blom H., Geissbuehler M., Lasser T., and Widengren J. 2010. Transient state monitoring by total internal reflection fluorescence microscopy. J. Phys. Chem. B. 114:4035-46.
Spielmann T., Xu L., Gad A. K. B., Johansson S. and Widengren J. 2014. Transient state microscopy probes patterns of altered oxygen consumption in cancer cells. The FEBS Journal 1-16.
Widengren J. 2010. Fluorescence-based transient state monitoring for biomolecular spectroscopy and imaging. J. R. Soc. Interface 7, 1135-1144.